Our Kinome features, signaling pathways, and drug response in HCC web app provides an interface to explore the data in our paper, Golkowski et. al. Cell Systems 2020. This Shiny app was developed by Dr. Ho-Tak Lau.
This page is also available as a pdf.
Sidebar :
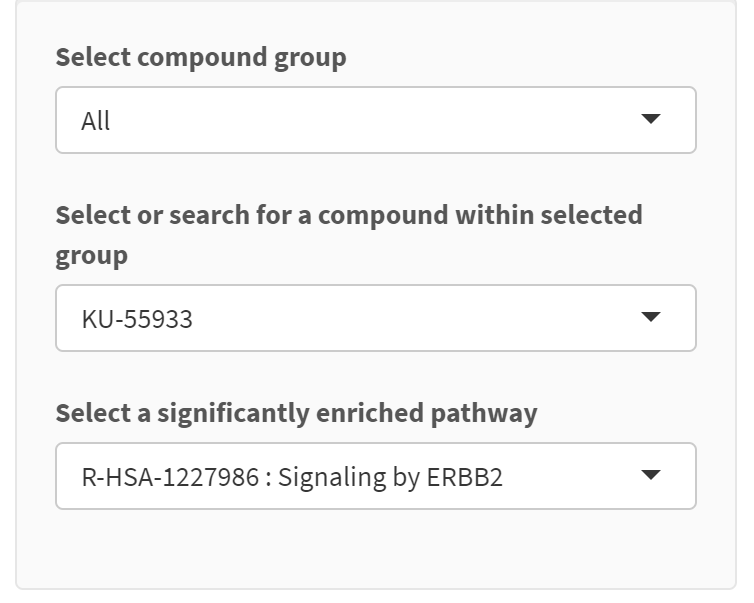
- Select compound group – The other two boxes below react to the selection in this dropdown and update their available selections accordingly;
- Select or search for a compound within selected group – A specific compound can be found by deleting the selected compound and by typing in a new compound name. Note that selecting options other than “All” in Select compound group will limit the compounds available for search;
- Select a significantly enriched pathway – Select a Reactome pathway for the currently selected compound that has an p-value ≤ 0.1 as calculated by the fgsea R package.
Tabs :
-
Heatmap of compound groups :

- The heatmap displays the clustering of compound similarity based on the Pearson’s correlation of their weighted normalized enrichment score (wNES) against 327 Reactome pathways. The wNES is computed as NES x (1 -adjusted p value). NES is an output of the fgsea R package;
- Hovering your mouse cursor on the heatmap will display compound names and their Pearson’s correlation (r-value).
-
Compounds in group :
- Depends primarily on the selection in Select compound group;
- Columns in table:
- Compounds in the selected group;
- Number of pathways: Number of pathways with a p-value ≤ 0.05. Includes both enriched and de-enriched pathways;
- Compound group for the selected compound in Select or search for a compound within selected group will be displayed if “All” is selected in the Select compound group drop down box
-
Group summary :
- Depends primarily on the selections in Select compound group and Select or search for a compound within selected group drop boxes;
- Displays in two sections - the enriched (upper panel) and the de-enriched (lower panel) Reactome pathways for the selected compound group;
- When “All” is selected in the Select compound group drop down box, a message will display the compound group that the selected compound belongs to, and the pathway information for that compound group is displayed;
- Columns in table:
- Pathway: Reactome pathway description
- Number of compounds: a count of compounds with a significant enrichment
- Cumulative NES : the sum of normalized enrichment scores for the compounds in column (2)
- Compounds : semi-colon separated list of compounds in the selected group with a significant association with the Reactome pathway.
-
Significant pathways for selected compound :
- Depends on Select or search for a compound within selected group;
- Shows the significant pathways (adjusted p-value ≤ 0.1) for the selected compound
- Columns in table:
-
Pathway : Reactome pathway description
-
pval : p-value computed by the fgsea package, used for filtering in the “Compounds in group” and “Group summary tabs”
-
padj : adjusted p-values computed by the fgsea package
-
ES : enrichment scores computed by the fgsea package
-
NES : normalized enrichment scores computed by the fgsea package
-
nMoreExtreme
-
size
-
-
Enrichment plot and leading edge features :
Depends on Select or search for a compound within selected group and Select a significantly enriched pathway;
Displays the GSEA enrichment plot and the leading edge proteomics features calculated for the association between the selected compound and the selected pathway
Columns in table:
- Gene name : Gene name for kinome feature (protein or phosphosite)
- peptide : peptide sequence window of the phosphorylated site p(S/T/Y) associated with the enrichment of the pathway. if N/A, expression of the protein is associated with the enrichment of the pathway.
Proteomics features vs drug response :
Depends on Select or search for a compound within selected group;
Displays the results of the high-throughput screening, specifically a low AUC means more cell killing. The more negative R-value indicates that a low AUC (strong drug effect) is correlated with higher proteomic feature abundance.
Only shows the proteomic features with a r > 0.4 or r < -0.4.
Columns in table:
- Gene name : Gene name for kinome feature (protein or phosphosite)
- Modified peptide window : peptide sequence window of the phosphorylated site p(S/T/Y). if N/A, change in protein expression rather than a specific phosphosite is correlated with drug AUC.
- Dynamic “Compound name” column : the Pearson correlation coefficient of proteomics features vs. cell viability (AUC). The more negative the value, the better the correlation of proteomic feature abundance with drug effect.
Please send comments and questions to Shao-En Ong (This email address is being protected from spambots. You need JavaScript enabled to view it.). This page is also available as a pdf.